 CloosphereAll Your AI, Safely in One Place.
 When an answer is wrong,
you can see exactly where
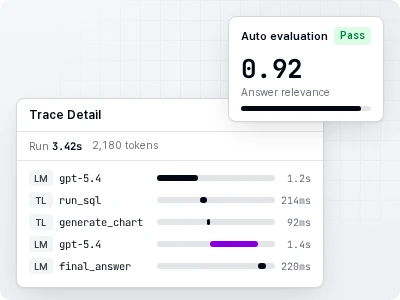
For a single question, you can see how many times the model was called, which documents were searched, which SQL ran, and where the time went. Quality scores build up automatically, so no one has to read every reply.
Three points where you lose track of what went wrong
All you get is "the AI gave a weird answer"
Find the trace by conversation ID and confirm whether the cause was retrieval, a tool, or the model.
You can't tell whether switching models actually helped
Compare with automatic scoring, per-model trends, and Arena rankings.
LLM cost only shows up at the end of the month
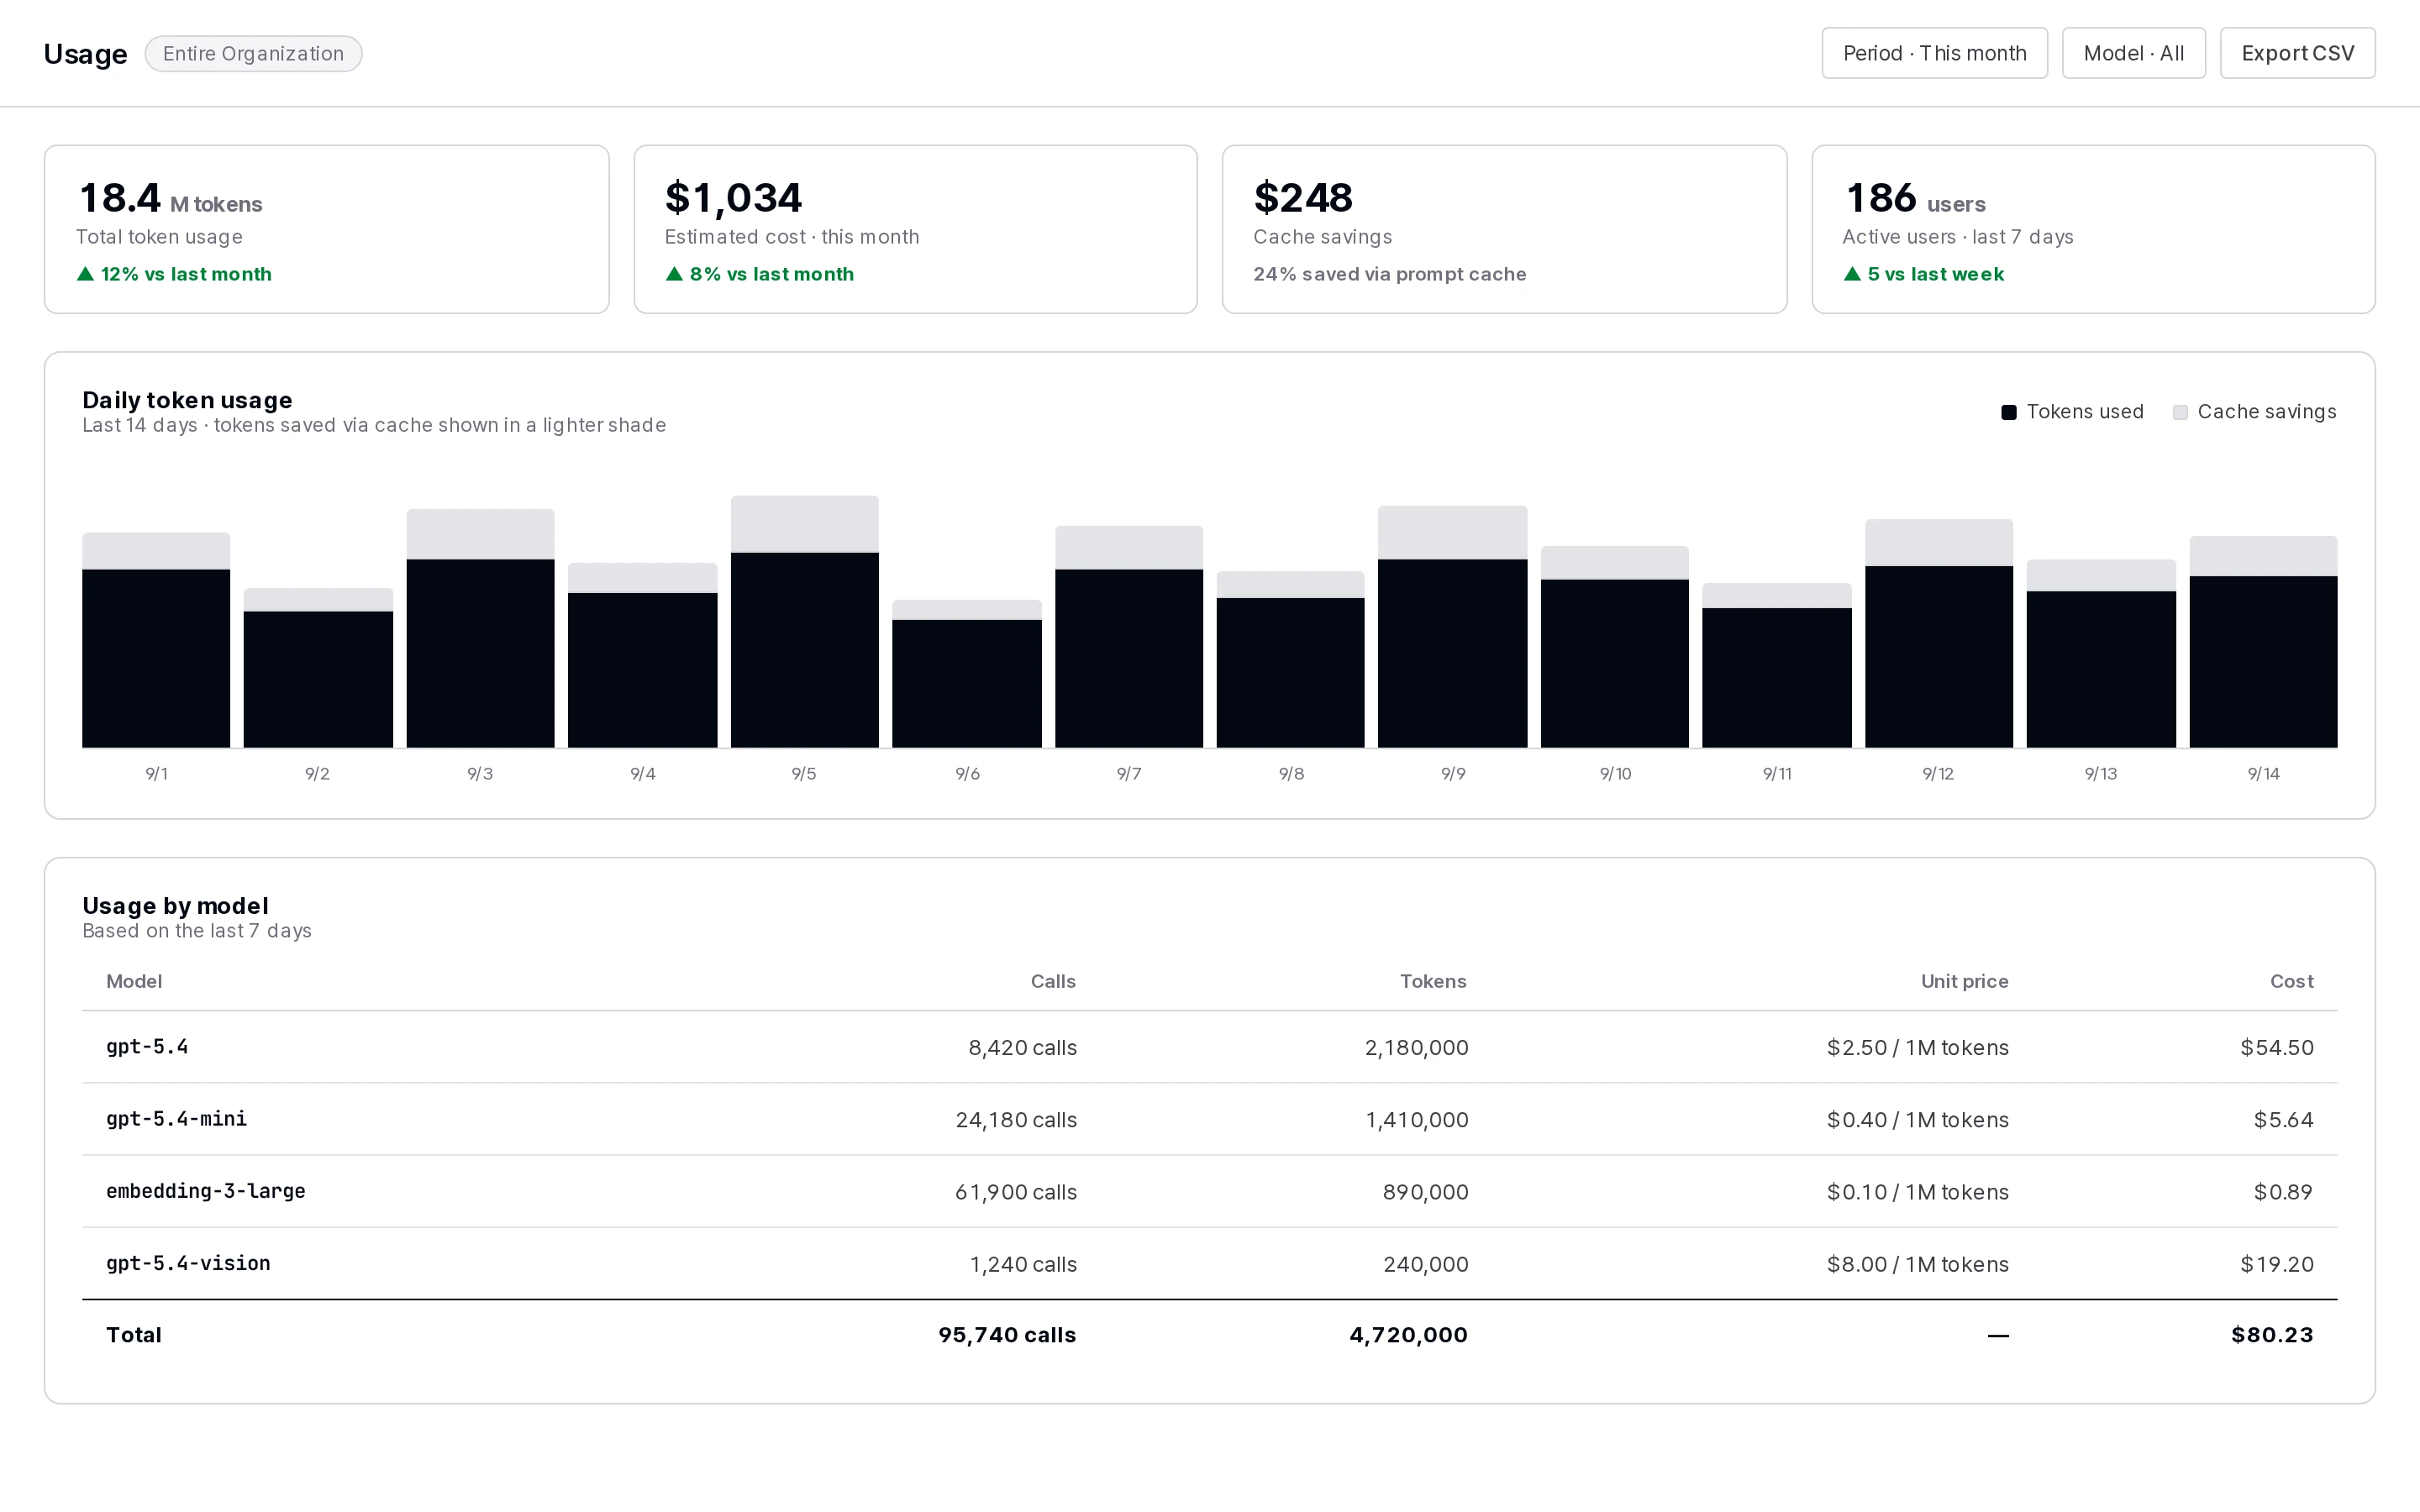
Register a per-model unit price and cost is estimated immediately on the usage screen.
Retracing a single run
Traces
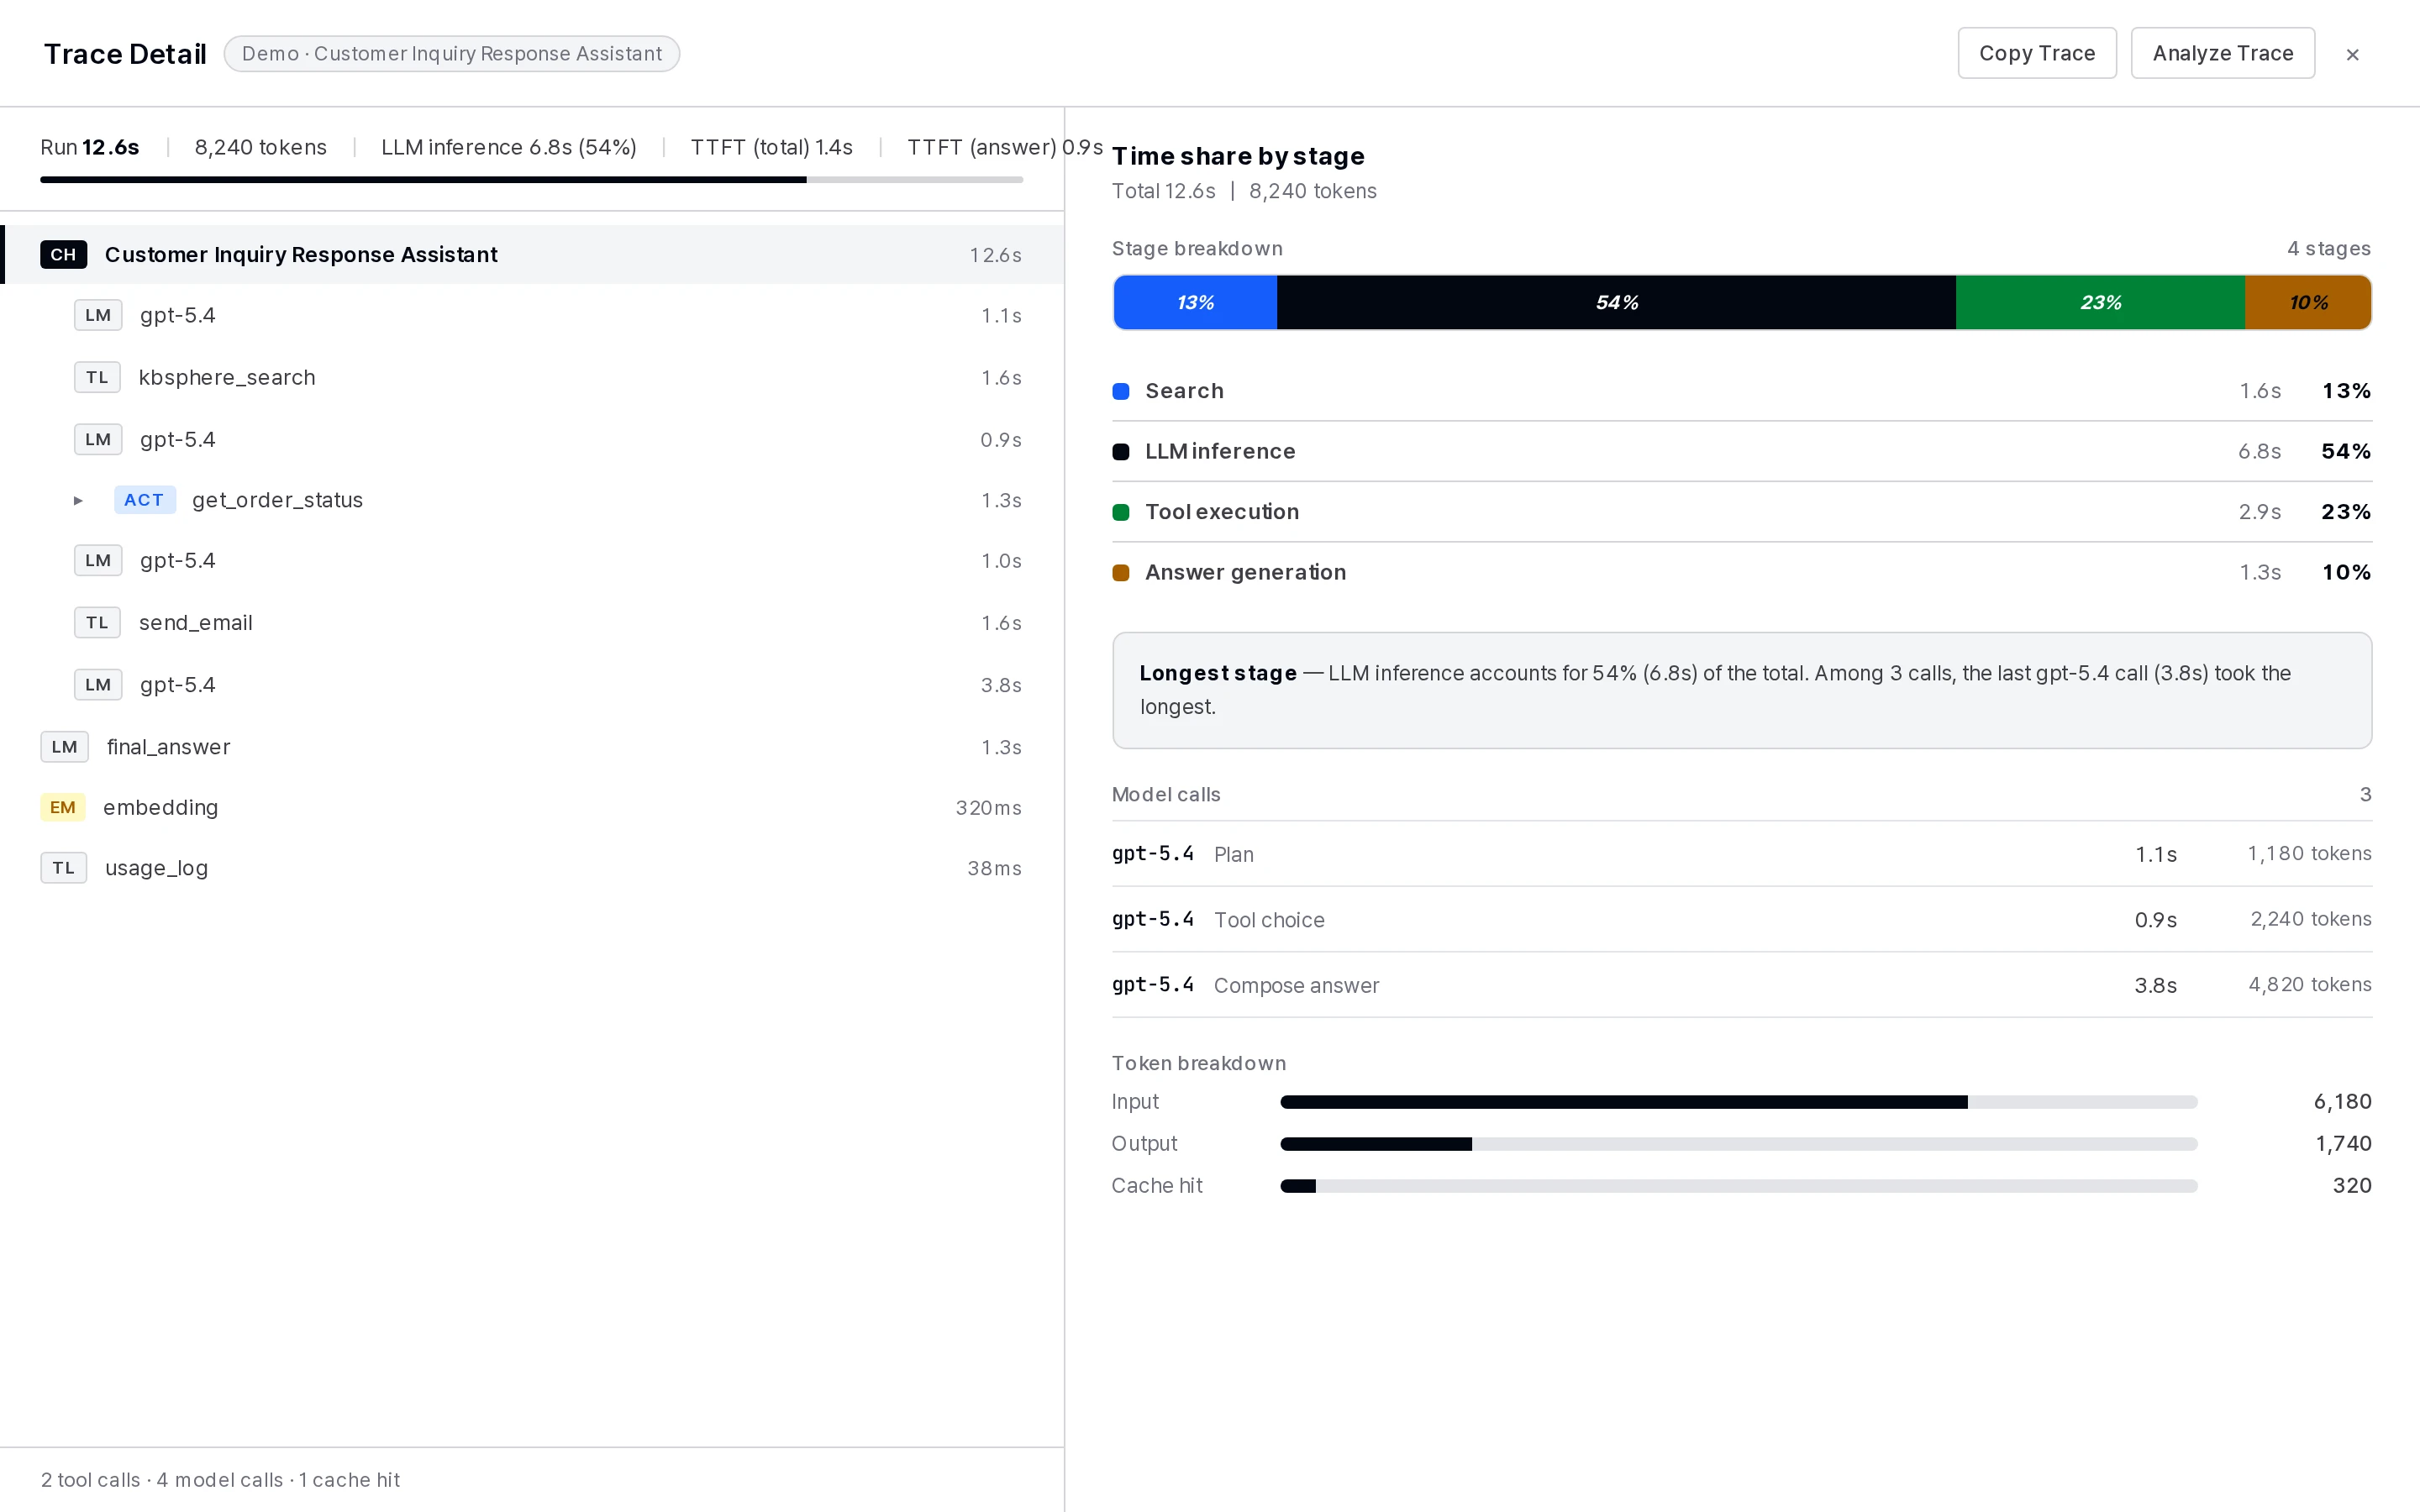
- Records the entire path behind a single answer — LLM calls, tools, retrieval, and guardrails.
- Tree, timeline, and token views, with the slowest stage flagged automatically.
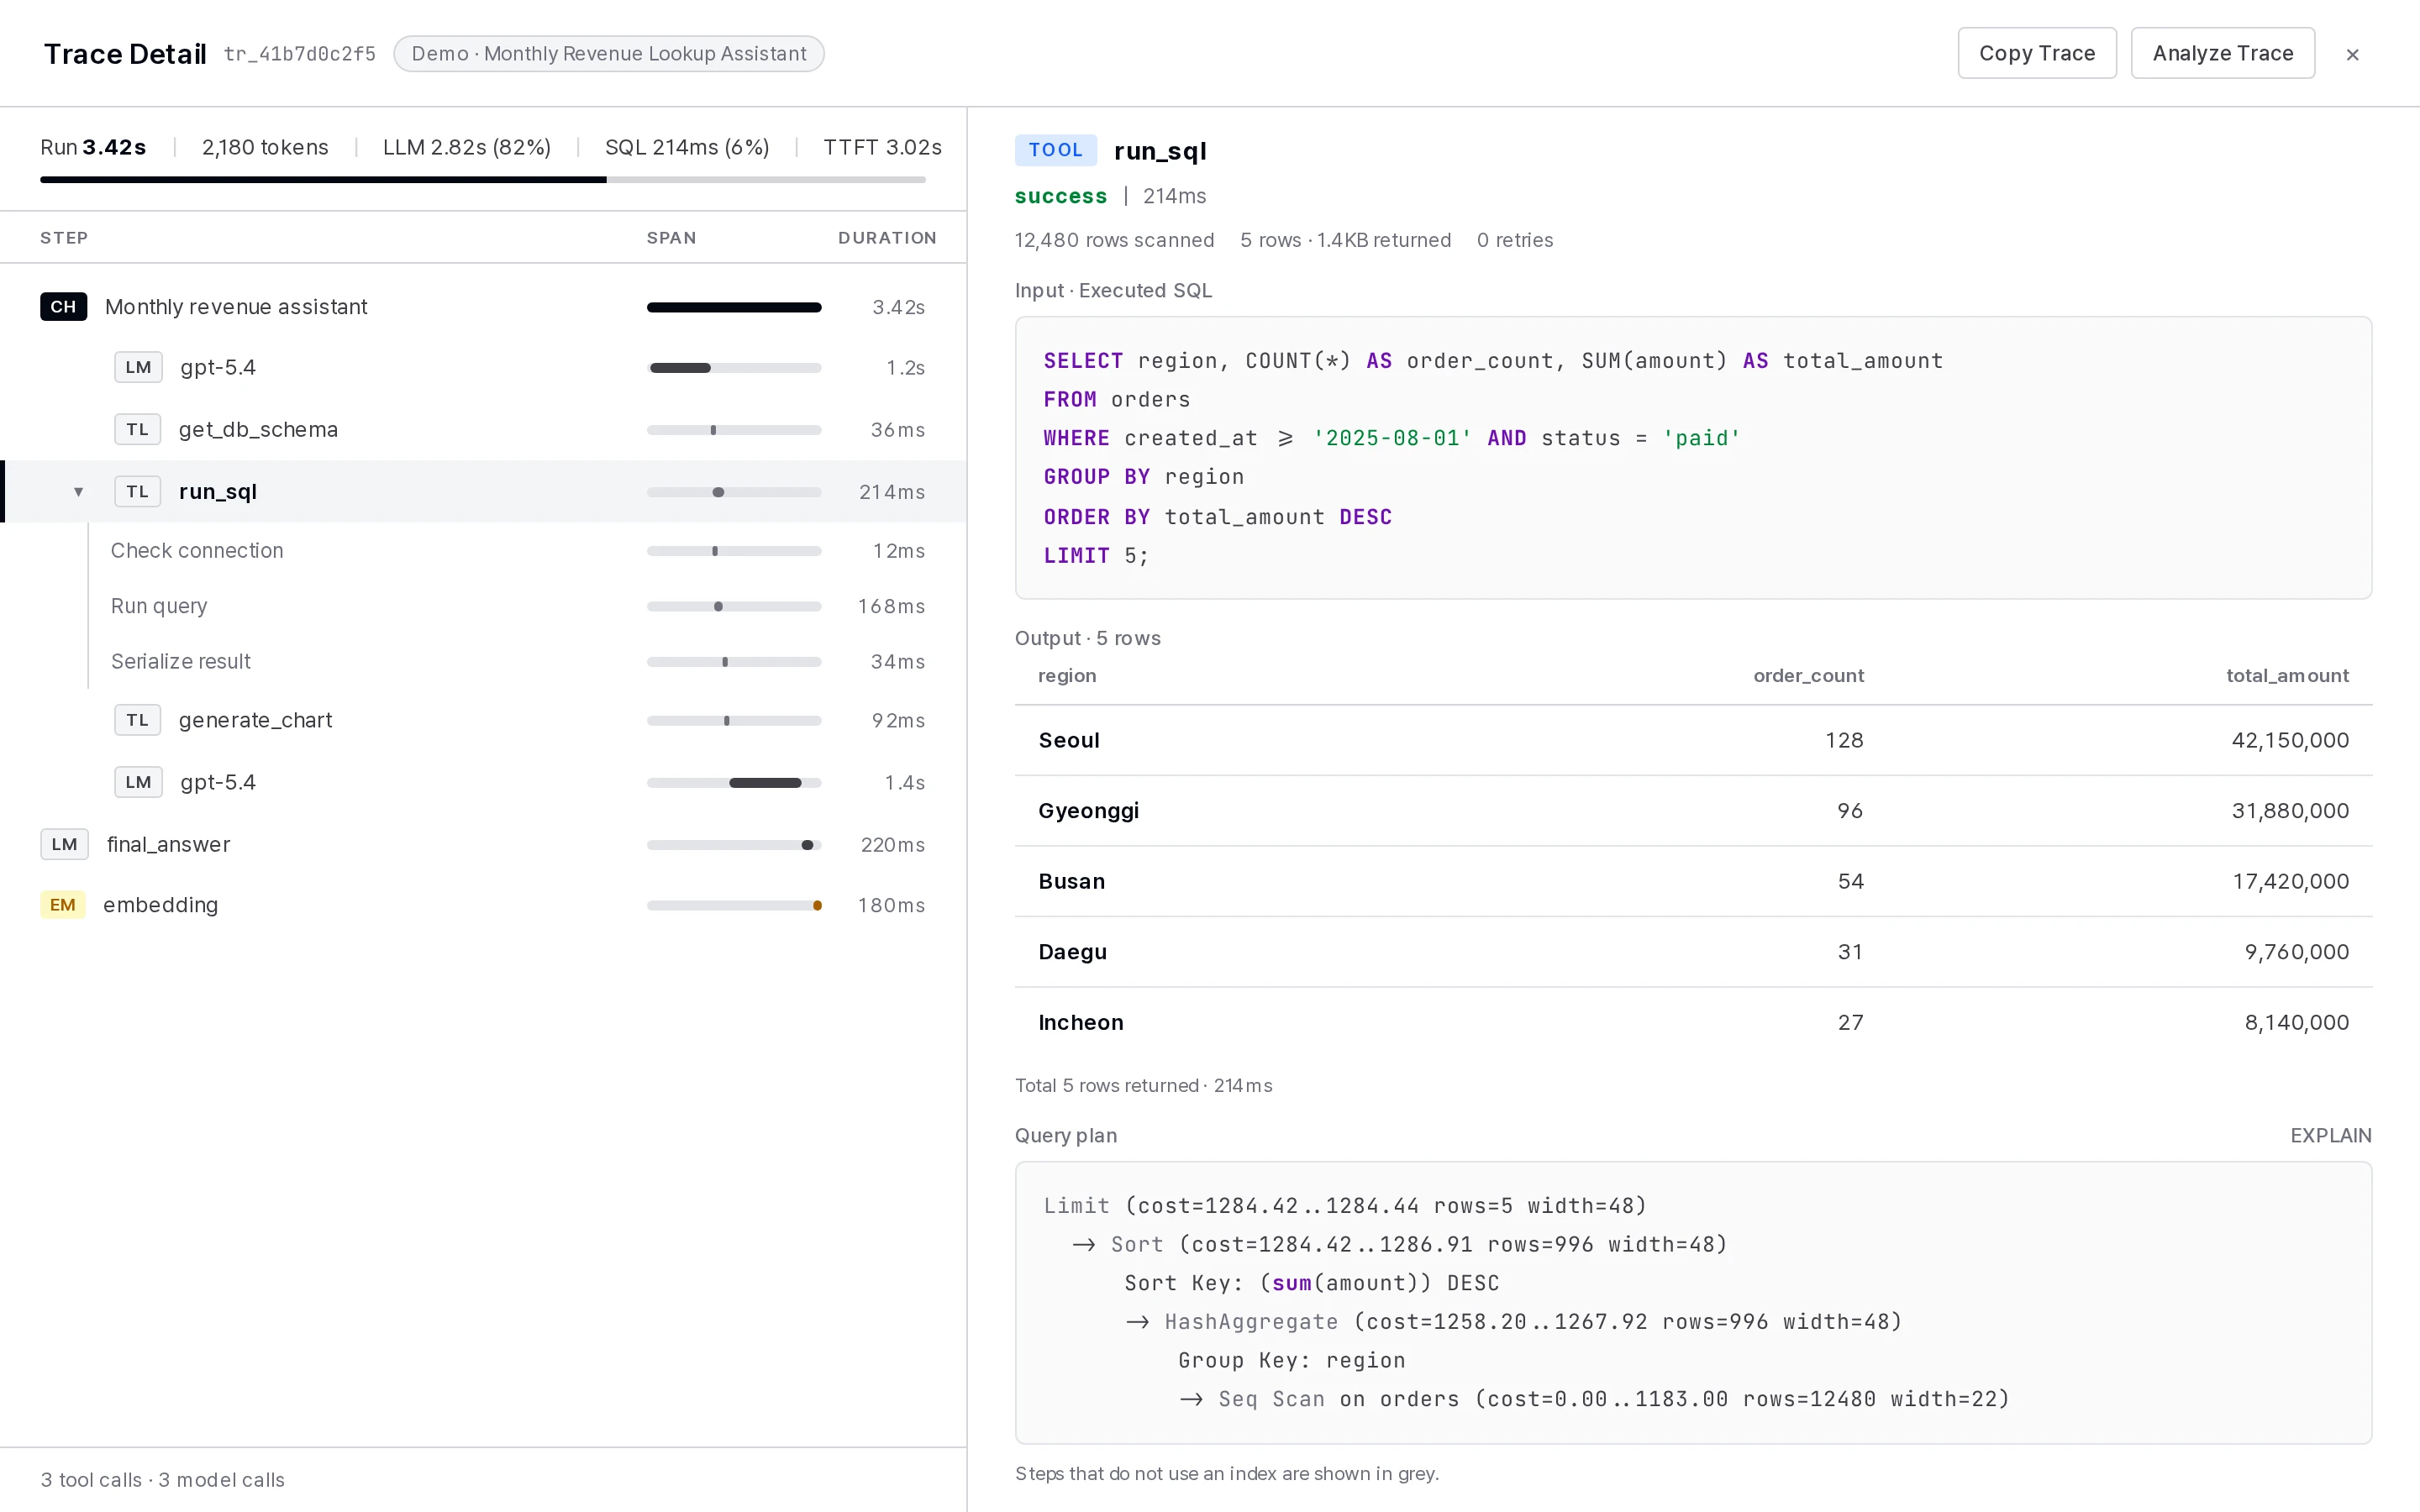
- Click a node to see its input and output (prompt, retrieval results, SQL, tool response).
- With a reasoning model, the reasoning summary and reasoning tokens are shown in the trace too.
Automatic quality evaluation
- Turn on automatic evaluation for an agent and a judge model scores each answer from 0 to 1 on retrieval quality, faithfulness, and response quality.
- User-uploaded attachments are excluded from the retrieval-quality score to keep scoring fair.
- View score trends by model and by agent.
Feedback · Arena
- Collects user feedback as structured, per-criterion data.
- Ranks models with an Elo-based score from head-to-head answer comparisons.
Usage
- Aggregates tokens by model, user, group, organization, and agent.
- View it as time series, treemaps, a day-of-week × hour heatmap, or a ranking table.
- Register a per-model unit price (input, output, cache) to estimate cost, in your chosen display currency. Savings from prompt caching are also shown in the time series.
- Look up conversation logs with filters.
Configuration health check
- One admin screen checks whether LLM connections, embeddings, extraction engines, search, web search, code execution, Code Gateway, notifications, voice, images, encryption, and licensing are configured, and what each one affects.
Trace and automatic quality scoring screens
The steps of one run stack up as a tree, and the slowest step opens with its input and output.
Licensing
Traces and evaluation are included from the Professional tier. Usage aggregation is available on every tier. → Pricing · licensing
We follow one of your own questions through a trace
We set up a demo environment based on your deployment method, integration scope, and governance requirements.